All Supporting modules
Analytics Support

Analytics Support – leverage your data into actionable insights
Airside operations generate a wealth of valuable data. Reports like RCR, SNOWTAM, FOD, and automated data from AWOS etc are a part of the daily, sometimes hourly, workflow. This data can be turned into a gold mine using Airside Syncs’ Analytics Support. With this module, you can easily leverage raw data into meaningful information and insights, to enhance efficiency, safety, and overall performance of airside operations.
Analytics Support is a module in our Airside Sync platform. It’s the tool that lets you access all the data in the database, and includes functions to utilize this data to your advantage.
With a few simple clicks, you can generate reports, compare and analyze any data sets, produce statistics, and create comprehensive dashboards to visualize and share your findings. Simply put, Analytics Support is the tool to turn your data into actionable insights.
“The massive amount of data stored within your Airside Sync account is a gold mine. With Analytics Support, you can transform all that data to valuable knowledge.”
Rickard Jönsson, Sales Director at Safe Sky
Analytics Support is a suite of tools that allows you to:
- Gain access to all the data – Analytics is an interface to directly access the database and all the raw-data stored in your database
- Create dashboards – Set up, display and share dashboards of KPIs, diagrams, tables, live data for any sets of data in your database
- Generate reports – Set up and schedule automatic generation of recurring reports or generate one-time analyses with minimal effort
- Simplify data analysis and generate statistics – with access to ALL the data in the entire database you have tools to make statistics and analysis of any datasets, correlations, trends, occurrences, tables, KPIs etc to acquire operational insights, strengthen readiness and make operations more efficient
- Export data – transfer datasets into Excel, PDF, or other formats for further analysis, reporting, collaboration etc.
How does it work
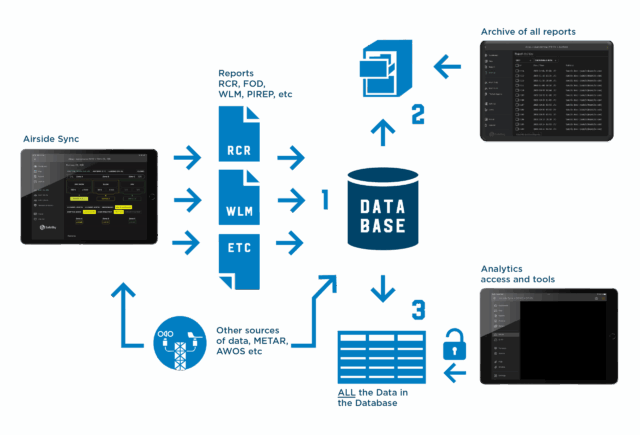
When you make assessments and create various reports, all that data is stored in a database. Alongside with that data, a lot of additional data (for instance weather-data from you METAR, potential GPS-data etc) are stored in the same database.
Of course, all individual reports that are generated can be retrieved in the digital archive within Airside Sync, including meta-data and audit-logs for each report. But Analytics Support gives you access to the entire database and unlocks all individual data, including containing sets of tools to help turn that data into valuable insights and information.

- When you create reports, all that entered or imported data, as well as a lot of additional data is saved in a database
- All the individual reports can be viewed and retrieved in the report-archive in Airside Sync
- The Analytics module is composed of tools that allows you to access and process all data in the database, extending beyond individual reports. With Analytics Support, you can explore the entire dataset and use powerful tools to turn raw data into valuable insights and actionable information.
Key functions & features
- Gain access to all the data in the database
All created reports, registered assessments, and imported data, including supplementary data like continuous METAR updates, are stored in a comprehensive database. If Airside Sync is integrated with adjacent systems (e.g., PIREPs) or used for other airside assessments (e.g., FOD, WLM, airside inspections), that data is also stored in the same database. While individual reports, along with metadata and audit logs, can be retrieved from the digital archive, Analytics is a set of tools that allows you to access and process all data in the database, extending beyond individual reports. For instance consolidating all the RCR-data on a weekly or monthly basis, analyzing statistics for the entire past winter season etc.
- Create dashboards
Analytics include tools for you to easily and intuitively create, display, and share comprehensive data dashboards featuring KPIs, diagrams, tables, and live data. Visualize key insights and make sense of complex data. This feature lets you build customized dashboards with any data you need, providing a clear and organized overview of KPIs and metrics. With extensive visualization options, such as bar charts, trend graphs, calendar, heatmaps, and geospatial charts, you can transform raw data into meaningful insights. Plus, sharing and presenting data to stakeholders is as simple as the press of a button. - Statistics and Analysis
With access to all the data in the entire database, you have the tools to find, analyze, and follow up on any data sets, correlations, trends, occurrences, KPIs etc.
Analyze your data to find ways to enhance the performance of your organization. This feature gives you the tools to utilize the data at your disposal to the fullest. It transforms raw data into data-backed insights and statistics, helping you optimize workflows, enhance safety, and make informed decisions in a matter of seconds. Analyze the number of RCR/SNOWTAM reports created month to month, how often did you have zero-degree passages, how many snow events did you have, find out how the wind affects the number of WLM-reports filed, or how often you had RCCs under 3 during the previous winter-season? Any data you can think of, Analytics Support is the tool to help you analyze it.

- Generate reports
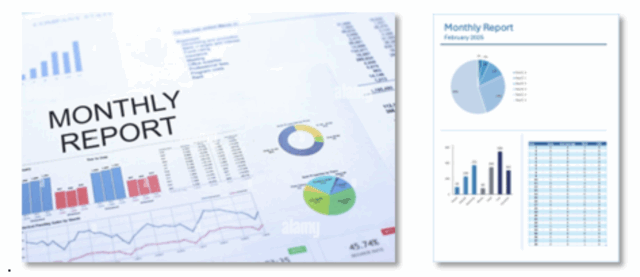
Create one-time reports or set up a recurrent generation of reports, for instance automatically recurring weekly reports, monthly reports, etc.
One-time reports
With powerful tools to access, filter, and retrieve any dataset in the database, generating analyses and reports for any query requires minimal effort. Whether you need a seasonal overview of RwyCC occurrences, a monthly count of precipitation days, correlations between WLM and weather conditions, or a year-long summary of RCR reports, Analytics makes it easy to extract the right data from the entire database. This ensures informed decision-making, enhanced operational knowledge, and deeper insights into airside conditions.
Automatically recurring report
A huge benefit comes from the possibility to set up automatically recurrent reports. Analytics offers a powerful automation feature for generating recurring reports. With flexible scheduling options, the system can automatically create daily, weekly, or monthly reports, delivering valuable summaries of KPIs, statistics, and essential insights. This ensures key information is regularly provided and up to date, eliminates manual reporting tasks, and keeps stakeholders informed. By maintaining a continuous flow of relevant data, it enhances knowledge, streamlines analysis, and supports better decision-making.

.
- Export data
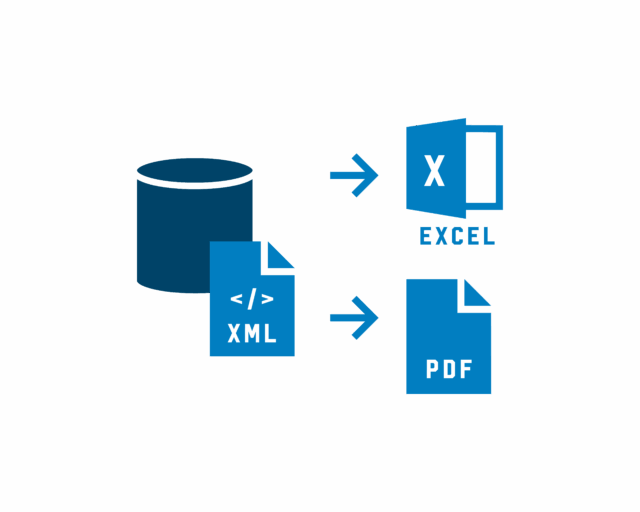
With Analytics Support, you can easily export selected datasets to Excel, PDF, or other formats. Flexible filtering options allow you to choose specific data based on date, data type, or other criteria, ensuring precise and relevant exports, making it effortless to share key findings, collaborate with stakeholders, and conduct further analysis.

Why choose Analytics Support?
Imagine a tool that doesn’t just collect data but converts it into meaningful information that can be leveraged into actions that elevate your operations. Analytics Support does exactly that. The modules’ customizable features make mastering your data effortless. And the ability to analyze and act on data can make a significant difference. Analytics Support empowers you to make informed, strategic, and data-driven decisions. Decisions that will enhance efficiency, safety, and overall performance of the airside operation. It enables you to go beyond surface-level monitoring, providing the tools to truly understand what it takes to be successful in this business.
- Real-time insights: Instantly access, analyze and display data for a clear, up-to-date view of your operations.
- Smarter decision-making: Combine data from various sources to uncover actionable insights that enhance safety and efficiency.
- Efficiency boost: Automate data processing, saving hours of manual effort.
- Improved safety: Detect trends and anomalies early to address potential risks proactively.
- Enhanced collaboration: Share real-time insights across teams for better communication and alignment.
- Compliance made simple: Stay audit-ready with streamlined reporting and data tracking.
ABOUT AIRSIDE SYNC
Airside Sync from Safe Sky Industries is a digital platform for airports to assess, report and analyze conditions at the aerodrome. The tools within Airside Sync gives the airside operations team unparalleled benefits compared to analog reporting with pen and paper or radio transmission. Airside Sync is a platform with possibilities for a vast range of airside operations, reporting and information sharing with multiple report-modules (RCR/SNOWTAM, FOD, WLM, Task-management) as well as supporting modules (Analytics Support, PIREP etc)
With the added benefit of being able to integrate with various different systems and sensors, both fixed and mobile, Airside Sync is truly the most user-friendly and easy way to report airside conditions.
ABOUT SAFE SKY
Sweden-based Safe Sky Industries is a world-renowned developer and provider of digital solutions for the aviation industry. Solutions that increase efficiency, improve safety, facilitate visualization of the operation status, and provide reliable decision support for the user. All in accordance with CDM. Safe Sky develops custom-built solutions by orders from clients as well as provides a range of more generic tools aimed to boost and maximize operation efficiency.


